Announcing Supafana’s New Alerting Functionality for Supabase Users
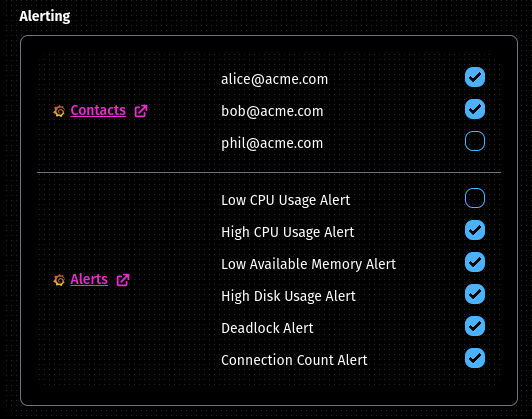
We are excited to introduce alerting functionality to Supafana, enhancing your observability and monitoring experience for Supabase. With this new feature, your hosted Grafana and Prometheus stack now includes pre-configured email alerts, keeping you informed about critical infrastructure metrics like high CPU usage, low RAM, low disk space, and high connection counts.

Why This Matters
Managing your Supabase project efficiently means preventing costly downtime and performance issues. Supafana’s new alerting system provides real-time monitoring and notifications, allowing you to take quick action when critical thresholds are breached. With these alerts, your team can ensure smooth operation and prevent potential service interruptions.
Key Features
- Pre-configured Alerts: Receive alerts for essential metrics such as CPU usage, memory, disk space, and connection usage—right out of the box.
- Email Notifications: Get immediate alerts in your inbox so that you can respond quickly to any problems.
- Seamless Integration: Integrated directly with your Supabase project, with a simple one-click deployment for fast setup.
How to Get Started
Supafana’s alerting functionality is now available as part of your observability stack. Whether you’re managing a production environment or working on a test project, setting up your monitoring and alerting is as simple as a one-click deployment.
For more details, check out the official Supafana repository or visit our website to explore these new features.
With these powerful alerting tools, you no longer need to worry about missing critical infrastructure warnings—Supafana has you covered!
